Grade Level: Primary School, Middle School, and High School
Math Investigation Type: Shape & Space
LEVEL:
This investigation is best for Grades 5 and up
MATERIALS:
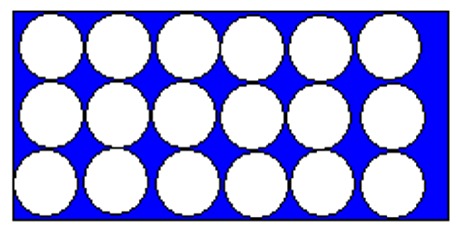
styrofoam cups, beans, a cardboard box. Set the styrofoam cups inside the box.
EXAMPLE:
OBJECTIVE:
- To involve students in a small group exploration of the concept of area for circles
- To use ratios of areas and probabilistic (Monte Carlo) simulation methods to determine some experimental estimates for the value of Pi.
- To extend students understanding of Pi.
- To explore the mysteries of Pi.
- To involve students in data collection.
LINKS TO THE CURRICULUM:
Shape and Space (Measurement, Geometry), Number Concepts (estimation, ratio and proportion), Number Operations (computation), Probability and Statistics (simulation)
Task
- Find out what each person in your group thinks will happen if 100 beans are tossed randomly into the box you are provided.
- How many will go into the cups? Record everyone’s guesses.
- Why do you think that many should go in the cups?
- Perform an experiment: Have everyone toss the beans from several steps away (to keep the distribution in the box more or less random).
- Count the number of beans that land in the cups.
- How many land in the box but not in the cups?
- How many land in the box, including those in the cups?
- Record your results.
- What is the ratio of the total area of the cup openings (at the top) to the area of the box opening?
- What should this have to do with the proportion of beans that land in the cups?
- In what sort of units did you choose to measure areas?
- If the diameter of a cup at the top is two ‘andars’, what is the area of the cup opening? The box?
- Is there any advantage to using ‘andars’ here as units?
- Express the relationship you found between the two ratios in (3) above as an equation.
- Your equation should involve , since the area of each circle is Pi times its radius squared. This equation expresses the fact that the ratio of beans in cups to the total beans in the box is an estimate for the ratios of the corresponding areas.
- Solve the equation you set up in (4) above for.
- How does it compare with values you have seen for ?
- Is it too big an estimate, or too small?
- What might account for the error in the estimate?
- This type of estimation through experimental simulation using randomly generated data (our bean tosses) is called the Monte Carlo method. Where is “Monte Carlo” and why is this a good name.
Background
Mathematicians and scientists have always been intrigued by pi, but it acquired a whole new following when it foiled a diabolic computer in a Star Trek episode. wears different hats — it is the ratio of a circle’s circumference to the diameter, it is a transcendental number (a number that cannot be the solution of an algebraic equation with integral coefficients).
One of the most curious methods for computing is attributed to the 18th century French naturalist, Count Buffon and his Needle Problem. A plane surface is ruled by paralled lines, all d units apart. A needle of length at least d is dropped on the ruled surface. If the needle lands on a line, the toss is considered favorable. Buffon’s amazing discovery was that the ratio of favorable tosses to unfavorable was an expression involving pi. If the needle’s length is equal to d units, the probability of a favorable toss is 2/pi. The more tosses, the more closely did the result approximate. In yet another probability method to compute pi, R. Charles, in 1904 found the probability of 2 numbers (written at random) being relatively prime to be 6/pi.
It’s startling to discover the versatility of pi, crossing as it does the wide spectrum of geometry, calculus and probability.