Grade Level: Primary School, Middle School, and High School
Math Investigation Type: Statistics & Probability
LEVEL:
This investigation can be entered into by children as young as 6 and is engaging for people who like to think about mathematical probability and dynamical systems.
MATERIALS:
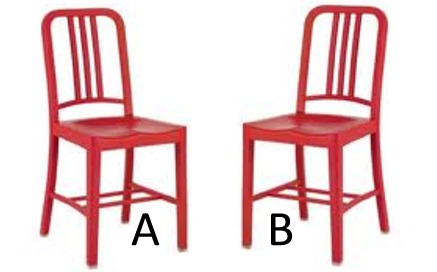
Labelled cards and 2 chairs (landmarks) labelled A and B.

OBJECTIVE:
To experience and visualize so-called Markov processes by moving between two locations according to certain probabilities, and to estimate the eventual proportion of actors at each location.
LINKS TO THE CURRICULUM:
Probability and Statistics, simulation, mathematical processes, numerical computation and visualization.
Task
- Place two chairs (or any other landmarks) far enough apart, which we label A and B. What do you think will happen to a bunch of ants, (or bacteria, molecules, viruses…) that are placed at either location and move to the opposite location with a certain fixed probability?
- Perform an experiment:
- Label the two chairs as A and B.
- For each chair, decide on a probability to move to the other chair. For a first experiment, let’s agree that the probability to move from A to B is ½ and the probability to stay at A is also ½. Let’s also fix the probability to move from B to A at ¾ and the probability to stay at B at ¼.
- Each actor should have two sets of cards( one for each chair, and labelled as to not get mixed up); you will pick one of these cards at random to determine which chair to move to. The set for chair Acould have 2 cards, one A and one B, thus giving a probability ½ of picking either A or B. The set for chair B could have three A cards and one B card, giving a probability ¾ to choose A and ¼ to remain at B.
- Now each actor being equipped with their two sets of cards, place themselves randomly at the chair of their choice, get the set of cards corresponding to that chair, pick a card at random, and move to the chair indicated on the card. They then repeat the process.
- Someone should be on duty to give the signal and record the process in a table, keeping track of the number of people at each chair.
- Repeat the process until you can discern a proportion of actors that appear to stabilize on the landmarks. Can you guess the proportions?
- Repeat the process a few times. Does it matter where the actors initially place themselves?
Applications
Markov processes are among the most widely used models in probability. Recently, attention has focused on interacting systems which have applications from image processing, communications networks, models of spread of disease, etc.
One interesting application of Markov processes concern the Norwegian offshore oil/gas industry. In Norway a state body, the Norwegian Petroleum Directorate, (together with the Norwegian state oil company (STATOIL)), helps plan the development of oil/gas offshore facilities.
The essential problem the Norwegian Petroleum Directorate has is how to regulate pipelines/field startup/production so as to maximise the contribution to the Norwegian economy over time. Here the time scales are very long, typically 30 to 50 years. Of critical importance is the oil price – yet we cannot sensibly forecast this with accuracy for this length of time.
To overcome this problem they model oil price as a Markov process with three price levels (states), corresponding to optimistic, most likely and pessimistic scenarios. They also specify the probabilities of making a transition between states for each time period (one year). Different transition matrices can be used for different times scales.
Population modelling studies (where we have objects which “age”) are also an interesting application of Markov processes. One example of this would be modelling the car market as a Markov process to forecast the “need” for new cars as old cars naturally die off.
Another example would be to model the clinical progress of a patient in hospital as a Markov process and see how their progress is affected by different drug regimes.
Another application would be to model various company’s market monopolies.
The three landmarks you suggest could be three different brands of cereal, three locations in the world (or whatever).
Extension
Design a new experiment by modifying the probabilities at each chair or adding a few more chairs (you’ll have to make new cards).
- Does the eventual proportion at each vertex change?
- Is it affected by the number of actors?
- Can you guess the eventual proportions only from the given probabilities at each vertex?
- The methods developed in linear algebra provide systematic ways to investigate these questions using the concept of a matrix.
